The Determination of Anaerobic and Lactate Threshold
Results
Overall, we found that blood lactate increased with increase in the resistance of the cycle and the duration of the test, (Table 1). The lactate level increased by 0.8 and 1.5 mM in subject 1 and 2 at the end of cycling with 60W and 90W respectively. However, at first nine minutes of the test, there were no significant change in lactate level and was below 4.0mM to both the subjects. There was marked increase in lactate level at the end of 120W and 150W, (6.3 and 11.2 respectively) in subject 1 where as two marked increased points (4.2 and 7.7 mM) are found at 120W and 180 W cycling in subject 2. Maximum oxygen uptake and minute ventilation increased in proportion to the increase in lactate concentration level and the load of exercise.
Table: 1 Final result. (Blood Lactate accumulation changes, gas analysis, total volume of expired air and respiratory exchange rate in relation to the change in resistance of the cycle).
| Subject No. | Workload (W) | VE (L/min) | VO2 (L/min) | VCO2 (L/min) | RER | Lactate (mmol/L) |
| 1 | 0 | – | – | – | – | 0.9 |
| 1 | 60 | 31 | 1.03 | 1.06 | 1.03 | 1.7 |
| 1 | 90 | 45 | 1.67 | 1.63 | 0.98 | 3.4 |
| 1 | 120 | 48 | 1.88 | 1.90 | 1.01 | 6.3 |
| 1 | 150 | 58 | 2.26 | 2.29 | 1.01 | 11.2 |
| 1 | 180 | 64 | 2.31 | 2.27 | 0.98 | 12.4 |
|
|
||||||
| 2 | 0 | – | – | – | – | 1.3 |
| 2 | 90 | 24 | 1.28 | 1.15 | 0.90 | 2.8 |
| 2 | 120 | 32 | 1.72 | 1.62 | 0.94 | 4.2 |
| 2 | 150 | 39 | 1.97 | 1.90 | 0.96 | 5.7 |
| 2 | 180 | 52 | 2.33 | 2.42 | 1.04 | 7.7 |
Discussion
The major finding of this study was that incremental in exercise intensity is associated with the range of changes in the blood lactate concentrations. However, onset of blood lactate accumulation period and rate of work defers in person to person. In contrary to our hypothesis (b), nonlinear increase in minute ventilation was not in close relation to the lactate threshold point or increase in the blood lactate concentration, Fig. 1 & 2).
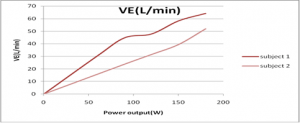
Fig. 1: Minute ventilation changes with increase in work intensity.
We accepted our result as we had neglected the particular muscles and muscle fiber types in the muscles which were involved during the test, which highly differ the balance between the production and the removal of lactate. “The work rate at which a nonlinear increase in ventilation occurs need not be the same exercise rate at which the lactate concentration increases” (Astrand, Rodahl, Dahland & Stromme, 2003, p=259).
Blood lactate
With regard to our first hpothesis, blood lactate increased markedly
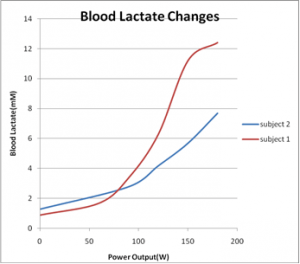
Fig. 2: Blood Lactate/Power output.
with the increase in resistance with both the subjects. Lactate accumulation was significantly higher (12.5mM) in subject 1 than in subject 2 (7.7mM) at maximum resistance of 180W, (Fig. 2). We assumed that because of the difference in basal lactate measurement there was marked difference between the subjects lactate readings. The result of study done by Davis and Gass, (1979), suggests that high initial concentrations of lactate result in to higher removal rate of lactate at the begining of exercise within low work load. This may be because of the difference in the oxidative capacity of muscle fibers involved in exercise, Ostrand et. al., (2003) between the two subjects. The delayed onset of lactate accumulation may also be due to the effect of glycogen sparing, (Davis, Frank, Whipp and Wasserman, 1979, p=1044).
Ventilatory Equivalent
With regard to our hypothesis (d), ventilatory equivalent is increased to the maximum at the beginning of the exercise with increment in intensity from the rest period. Ventilatory equivalent decreased with increase in oxygen consumption, just below the anaerobic threshold or onset of 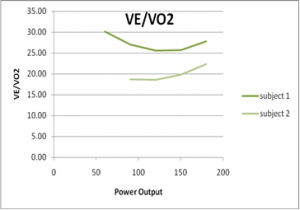
Fig. 3: Ventillatory equivalent for O2 in relation to power output.
lactate production ventilatory equivalent is abruptly increased due to high production of carbon dioxide and reduction in the oxygen consumption, determining the point of anaerobic threshold, (Fig. 3). The ventilatory equivalent for CO2 remain linear for subject 2 but there was abrupt increase at 180W in case of subject 1 which was along with the nonlinear increase point for oxygen,(Fig. 4). We assumed that subject 1 might have gone
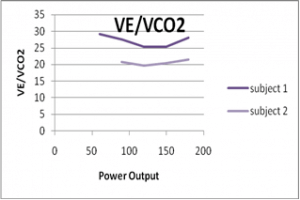
Fig. 4: Minute ventilation for CO2 in relation to power output.
to fatigue of some working muscles resulting in no contraction or work from the muscle and thereby causing less metabolic reactions and lactate formation and hence resulting in less CO2 production, Garrett and Kirkendall, (2000).
Respiratory exchange ratio (RER)
RER was increased with increase in lactate threshold because of higher rate of lactate buffer systems resulting into high production of carbon dioxide than oxygen consumption, which supported our hypothesis (e). This clearly defined that body has taken more of anaerobic pathway to generate the energy required to meet the demand of the work intensity at the later stages of the test. RER of subject 1 reduced at the final stage of the test which was assumed to be the effect of muscle fatigue, (Table 1). When fatigue, muscle loses its property of contraction and hence there will be no more metabolic reactions and muscle tends to consume some oxygen just to recover from the fatigue slowly rather than to work or contract, (Astrand et. al., 2003).
Conclusion
The determination of anaerobic threshold and lactate threshold depend on the exponential increase in blood lactate concentration as a result of a person overcoming certain level of exercise intensity or oxygen consumption. Also the breaking point or the abrupt increment point in pulmonary ventilation versus oxygen uptake has been taken into consideration to determine the anaerobic threshold. However, it is difficult to establish a well defined point to determine the anaerobic and lactate threshold as the rate and nature of metabolic reactions differ within an individual according to the type and nature of the muscles and muscle fibers used during work, the type of fuel substrate being oxidized, and the oxidation capacity, capillary density and enzyme pattern of the muscles being used.
Reference

Study on Counter Movement Jump Performance in a Force Platform – Part 2

Rotator cuff injuries: clinical relevance of measurement of ROM